

Module 7: Malleable C2 and Communication Evasion
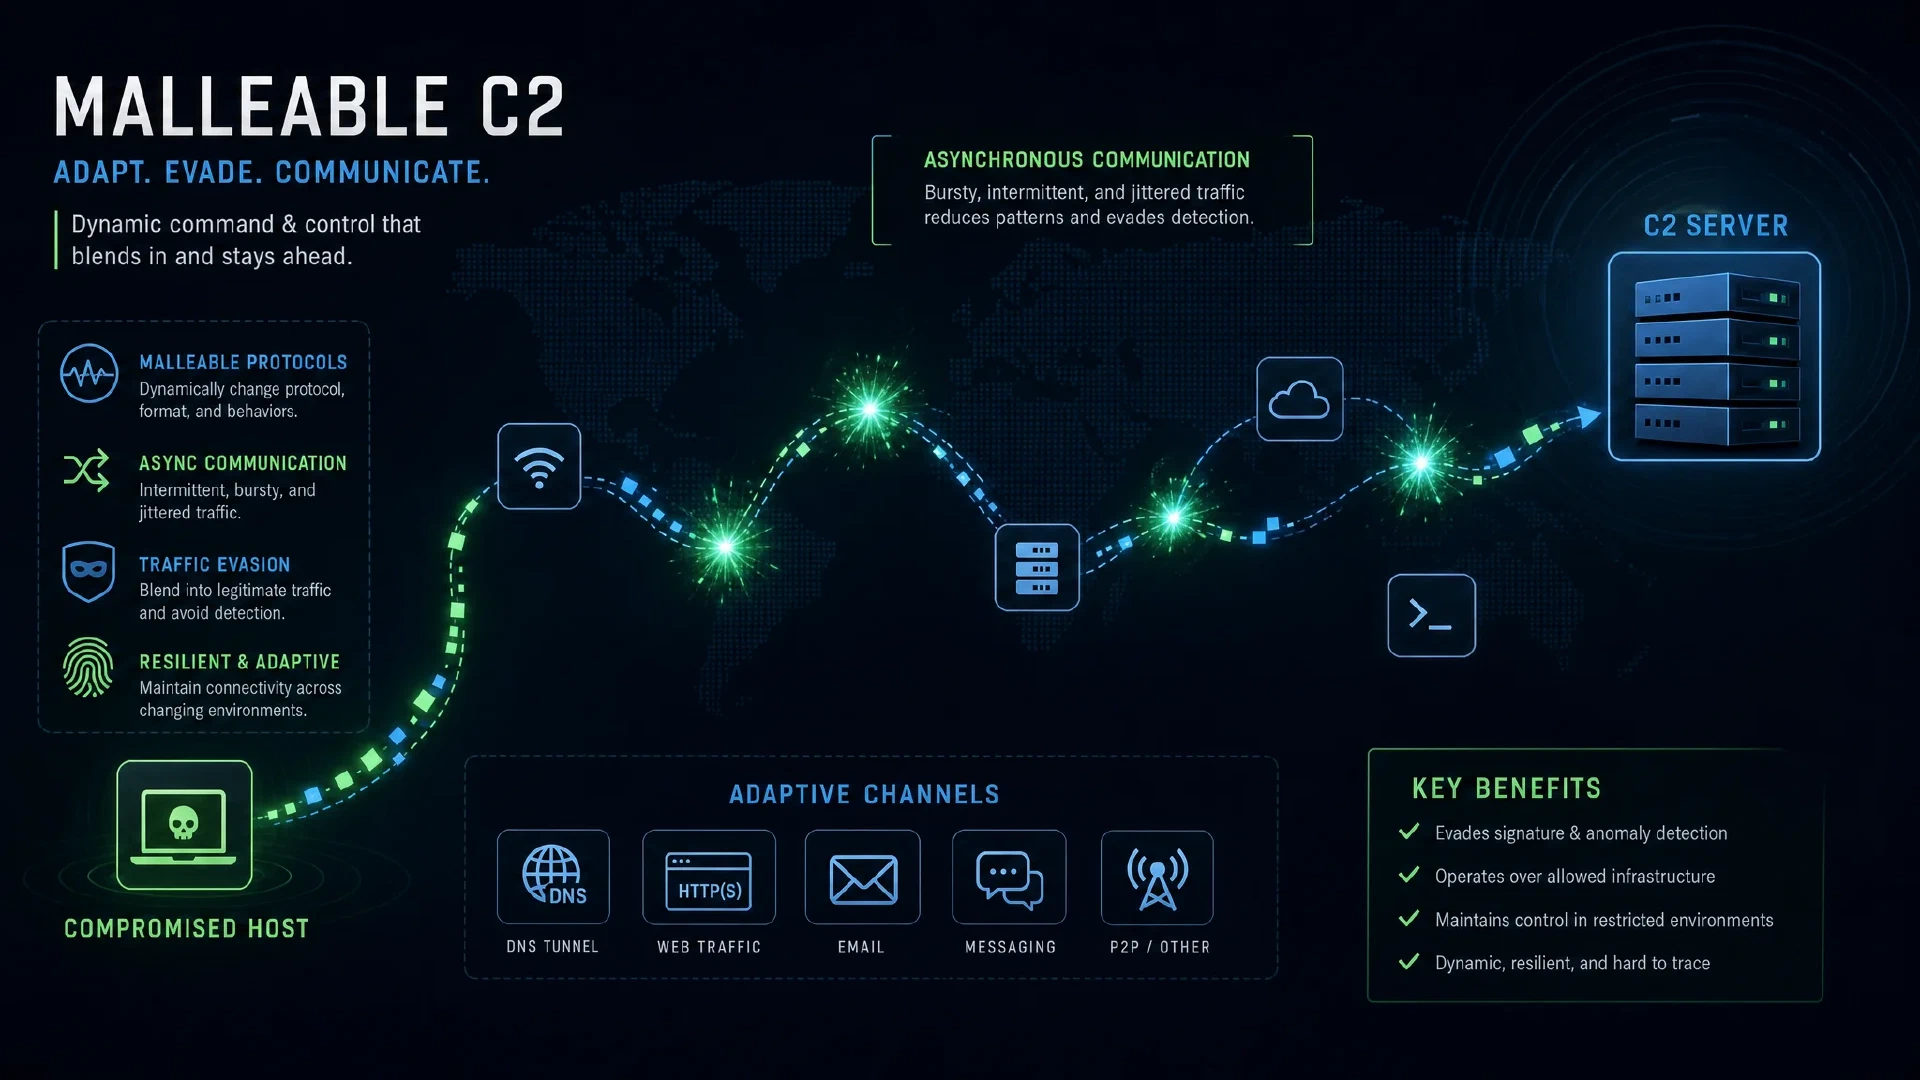
Table of Contents
← Return to the Red Team Course
A Malleable C2 profile describes configurable aspects of Cobalt Strike communication and related behavior. It changes indicators, but a changed indicator is insufficient evidence of a bypass. This module teaches you to separate configuration validity, successful communication, collected telemetry, and detection outcomes.
Allow about 20 minutes, plus time for the local HTTP exercise. The exercise sends harmless requests to your own loopback interface and does not deploy an agent.
What You Will Learn
- Define profiles, transforms, polling, jitter, and observation points.
- Explain which parts of an HTTP exchange different sensors observe.
- Inspect two local requests and compare their records.
- Evaluate the evidence behind a claim of reduced detection.
- Create a controlled comparison with explicit assumptions and limits.
| Term | Meaning |
|---|---|
| Profile | Configuration describing selected communication and runtime behavior |
| Transform | Reversible operation used to encode and recover exchanged data |
| Polling | Checking periodically for work or results |
| Jitter | Variation applied to a timing interval |
| Telemetry | Recorded observations of system or network activity |
| Detection | Logic interpreting observations as a condition of interest |
Understand Profile Scope
The communication profile describes where data appears in transactions and how the receiving side recovers it. This is more specific than changing a display name or cosmetic label. Both ends need compatible expectations for the exchange to work. Read the Malleable C2 overview .
Other profile sections govern aspects of memory, process injection, and post-exploitation jobs. Keep those settings separate from a claim about network behavior. A change in one category is not evidence of a result in another. Read the profile-extension overview .
Configuration behavior is version-specific. The 4.13 documentation introduces overrides for a defined subset of settings when generating new payloads. Check the documented override scope instead of assuming a restart is always required or every running agent inherits an edit. Read the override documentation .
| Question | Evidence needed |
|---|---|
| Was the profile accepted? | Validation output and selected configuration |
| Did the exchange work? | Correct decoded result through the tested path |
| What did a sensor see? | Sensor record, configuration, and timestamp |
| Did a rule alert? | Rule identity, outcome, and evaluation window |
Separate Four Outcomes
Syntactic validity means a configuration passed specified checks. Functional success means the intended exchange produced the expected result. Neither outcome establishes how a security product classified the activity.
Telemetry collection precedes many detection decisions. A request might be recorded without generating an alert, or an alert might depend on later correlation with endpoint behavior. Report those stages independently so an absence of alerts does not become a claim of invisibility.
Response adds another stage after detection. An analyst’s investigation or a containment action depends on workflow, policy, and available context. A test of network visibility should not silently become a claim about the entire response program.
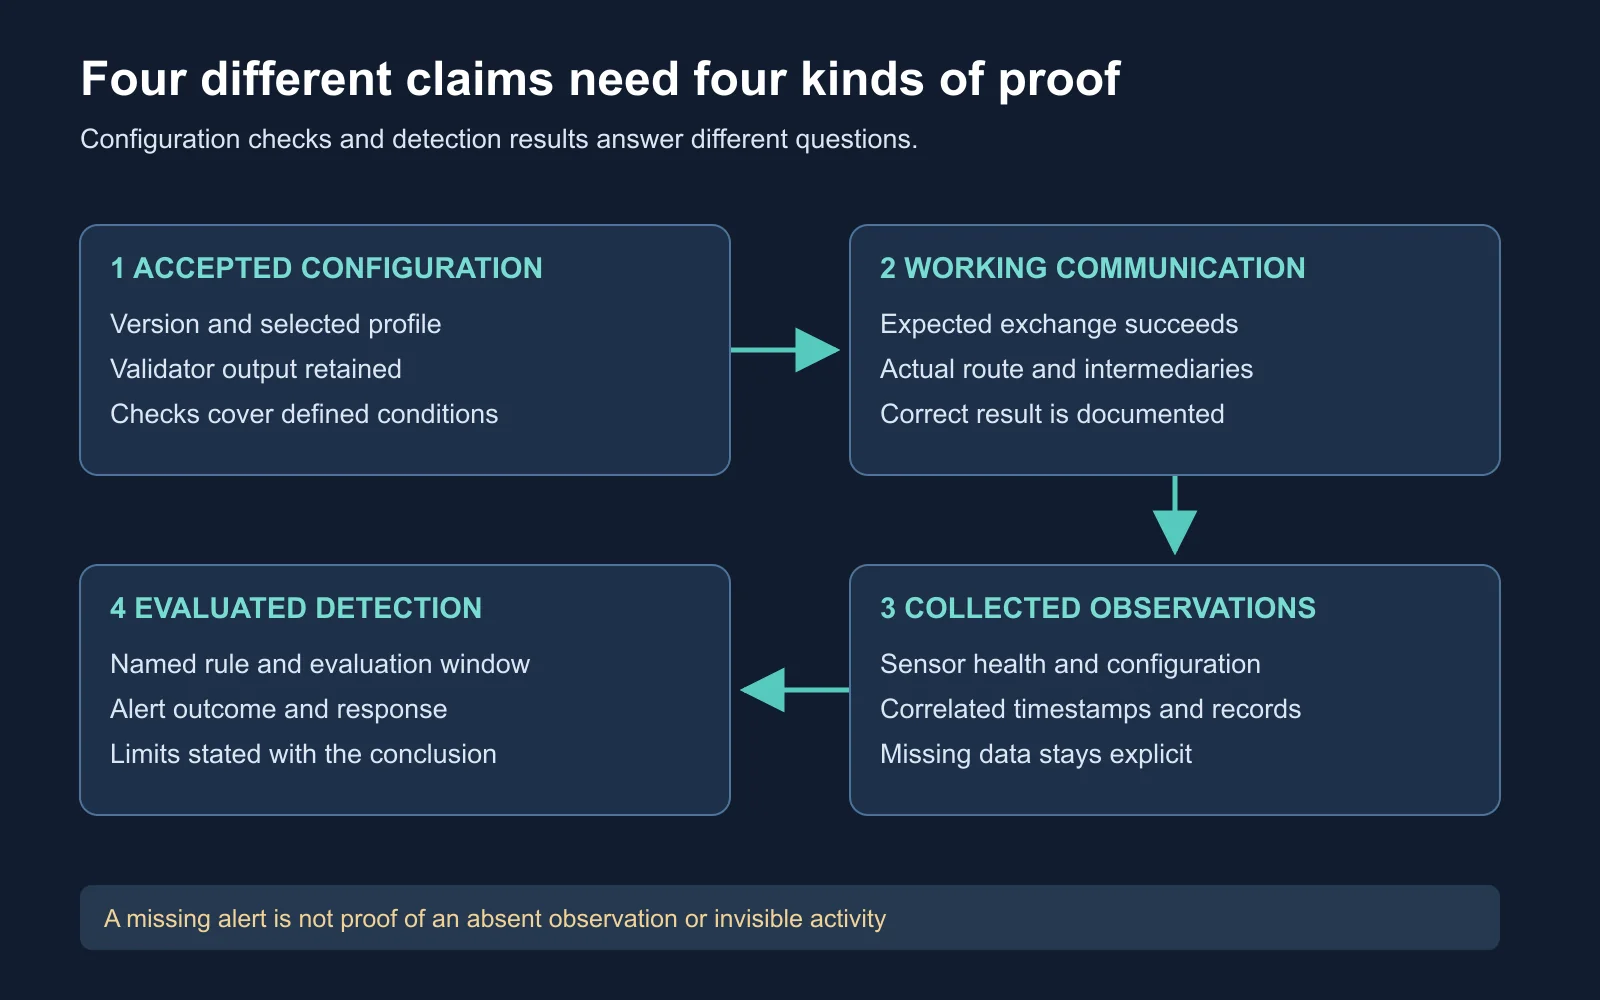
A pass at one stage leaves the following stage unproven
Read HTTP in Context
An HTTP request includes a method, target, headers, and sometimes content. A user-agent value is supplied by the client and does not authenticate the application sending it. Read the whole exchange and its context before assigning meaning to one field. Read the HTTP semantics specification .
HTTPS protects application data in transit between TLS peers. A passive observer outside the TLS session does not ordinarily read its HTTP path and headers, while an endpoint or configured inspection proxy has a different view. State the observation point whenever you discuss visibility. Read the TLS 1.3 specification .
Network metadata still carries useful context, including observed endpoints, timing, and traffic sizes. Which names and application details remain exposed depends on the actual protocols and deployment. Do not equate encrypted content with a complete absence of observable behavior.
| Observation point | Typical evidence | Main limitation |
|---|---|---|
| Application server | Received request and response outcome | Its configured logs omit some fields |
| Endpoint sensor | Process and connection context | Coverage depends on configuration |
| Passive network sensor | Traffic timing and transport metadata | Encrypted application content is restricted |
Check Functional Validity
c2lint is the vendor’s profile-checking tool. It checks syntax and performs additional tests using generated data. Use it as evidence about configuration validity, then validate the actual permitted communication path separately.
Read the validator documentation
.
./c2lint /path/to/approved-lab.profile
The path argument selects an existing profile for validation. Run the validator supplied with the release under review and retain its output with the profile’s hash. This command checks a file, so it does not prove an agent exchanged tasks through a proxy or a detection rule evaluated the resulting traffic.
| Exit code | Documented meaning |
|---|---|
| 0 | No reported errors or warnings |
| 1 | Warnings only |
| 2 | Errors only |
| 3 | Both errors and warnings |
Intermediaries introduce additional variables. A proxy might rewrite a field, enforce a body-size limit, or reject a request under policy. Successful direct communication in a lab is insufficient proof of the same behavior through a different path.
Inspect Harmless Local Requests
Create a disposable directory containing one synthetic text file. The following commands create it under your temporary directory and start Python’s demonstration HTTP server bound to 127.0.0.1. The --directory argument limits the served tree to the generated folder.
Read Python’s HTTP-server command-line documentation
.
lab_dir=$(mktemp -d)
printf 'synthetic training response\n' > "$lab_dir/sample.txt"
python3 -m http.server 8765 --bind 127.0.0.1 --directory "$lab_dir"
Keep this terminal open while making the requests below in a second terminal. The server is a local teaching aid, not a production service. If port 8765 is occupied, choose an unused port and update both commands consistently.
curl --noproxy '*' --verbose \
  --user-agent 'CourseLab/1.0' \
  http://127.0.0.1:8765/sample.txt

curl --noproxy '*' --verbose \
  --user-agent 'CourseLab/2.0' \
  http://127.0.0.1:8765/sample.txt
--noproxy '*' bypasses configured proxies for these requests. --verbose prints request and response details, while --user-agent sets the client-supplied header. The response body remains the same synthetic file in both cases.
Read the curl options reference
.
| Record | Expected comparison |
|---|---|
| curl request details | User-agent changes between requests |
| Response body | Same synthetic content |
| Default server log | Request line and status, without every request header |
Interpret the difference: a header changed even if the default server log does not display it. Missing fields in a log reflect the record’s coverage, not necessarily the absence of those fields on the wire. These are expected observations for the example, so compare them with your own run and explain any discrepancy.
Finish the exercise by pressing Ctrl+C in the server terminal. In the same shell, run printf '%s\n' "$lab_dir" to identify the generated folder and remove only the disposable folder when your notes are saved. This exercise measures HTTP representation and logging coverage, not Cobalt Strike behavior or an EDR result.
Evaluate Detection Claims
A fair comparison defines one changed variable and keeps the remaining conditions stable. Record sensor configuration, rule version, clock reference, workload, and collection window. If several settings change together, attribute the result to the combined experiment instead of guessing which change caused it.
Endpoint detection and response (EDR) combines product-specific sensors and analysis. Direct API use, fewer child processes, or a changed memory layout does not establish the absence of other observable activity. Microsoft’s Sysmon documentation offers concrete examples of separate process, network, registry, and image-load observations. Review the documented events .
Reputation is separate from correctness. Uploading an artifact to a scanning service is not a way to make it trusted. VirusTotal describes sharing submitted samples with its partners and community, so submission decisions require the artifact owner’s data-handling policy. Read how VirusTotal works .
| Claim | Evidence problem | Better conclusion |
|---|---|---|
| “No alert means unseen” | Collection and rule coverage unverified | No alert observed in the stated window |
| “Longer sleep is safer” | Timing changed without measured detection | Lower request frequency in this run |
| “A renamed process is trusted” | Name treated as provenance | Identity and behavior still require review |
| “The profile passed lint” | Syntax treated as a security outcome | Specified validation checks passed |
Work a Comparison Case
Illustrative scenario: two synthetic request runs each complete successfully. Run A produces an alert and Run B does not. Before Run B, the operator changes the user-agent and the analyst disables the relevant network-event collection rule.
Evaluate the conclusion: is the new user-agent responsible for the missing alert? Identify the confounding variable and write a justified next step. Keep the distinction between actual request behavior and available evidence explicit.
Expected reasoning: the comparison does not isolate the user-agent change. Collection changed as well, so the experiment cannot establish causation. Restore the agreed observation configuration, confirm it with a benign control, then repeat a bounded comparison with one changed variable.
Question:
Fixed environment and software versions:
Changed variable:
Baseline and comparison workloads:
Sensor health and collection configuration:
Expected observation and alert criteria:
Run IDs and timestamps:
Raw evidence locations:
Observed result and missing data:
Supported conclusion:
Follow-up or closure decision:
Your deliverable is a comparison record another reader would repeat using synthetic traffic. Include one alternative explanation for the result and the check which would distinguish it. Keep operational configuration details separate from unsupported claims about universal evasion.
Watch the C2 Lecture
The Cobalt Strike Archive lecture introduces the profile language and communication design. Use it to identify the distinctions between an indicator, a transport dependency, and a claimed security outcome. Compare its examples with the evidence requirements in your experiment record.
This historical 2019 lecture predates current releases. The documentation linked above takes precedence for current settings and supported behavior.
Watch on YouTube: Red Team Ops with Cobalt Strike (3 of 9): C2 .
Check Your Understanding
- Configuration: why does successful linting leave end-to-end behavior unproven?
- Observation: why should every visibility claim name its sensor location?
- Experiment: what invalidates the two-run comparison above?
- Reporting: how would you phrase an absent alert without claiming invisibility?
| Question | Expected reasoning |
|---|---|
| Configuration | The real route and its intermediaries were not exercised |
| Observation | Encryption, endpoint context, and log configuration change the available view |
| Experiment | Both the traffic field and collection configuration changed |
| Reporting | Name the rule, collection state, window, and absence observed |
Next Steps
Evidence quality matters before any endpoint interaction as well. Continue to Module 8: Open-Source Intelligence to evaluate public information, freshness, and corroboration. Return to the Red Team Course hub for the full sequence.