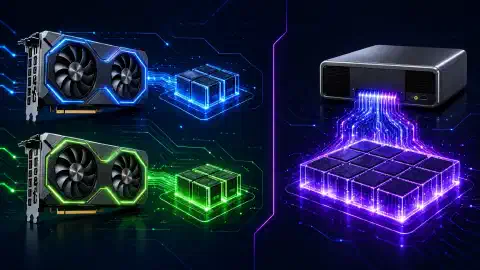

GPU ROI for Qwen3.8 27B: Mining vs API Token Savings in 2026
Table of Contents
A GPU has two possible payback stories. Crypto mining might earn money. Local inference might replace hosted calls. The better path depends on card price, electricity, runtime support, model speed, and actual hours of use.
This comparison covers 42 GPUs and unified-memory systems with a focus on Qwen3.8 27B. The default view shows 41 entries with at least 24GB. The catalog includes current consumer cards, professional cards, data-center accelerators, used legacy hardware, DGX Spark, AMD Strix Halo, and the Radeon AI PRO R9700.
The explorer treats 0.115 as US$0.115 per kWh, or 11.5 cents per kWh. Enter 0.00115 only when your electricity rate is 0.115 cents per kWh.
The Short Answer
The used RTX 3090 has the strongest modeled API payback in this snapshot. The card’s 40 tokens per second result is measured, and the price is lower than newer high-end cards. At the default frontier token value of $10 per million tokens, the modeled payback is about 36 days before fixed system cost and downtime.
The RTX 4090 has the strongest modeled mining payback among the cards with a public mining row. Its captured gross mining estimate is $8.74 per day. After $0.77 per day in GPU electricity, the model shows about 325 days at a $2,589 price.
The H200 is the fastest card in the table at an estimated 220 tokens per second. Its price is about $32,500, so throughput does not translate into the best payback. The MI300X, H100, and RTX PRO 6000 family also deliver high estimated speed at a large capital cost.
The RTX 5090 is the cleanest 32GB CUDA path. The card has an estimated 72.5 tokens per second rate, broad CUDA support, and a current modeled price near $4,999. Payback improves at high inference use, but the 3090 still wins the modeled token-savings comparison because the purchase price is much lower.
How the Explorer Calculates ROI
The explorer uses one set of assumptions. Change the comparison without rewriting the table.
| Input | Default | Calculation |
|---|---|---|
| Electricity | $0.115/kWh | GPU watts × 24 hours × power price |
| Average API value | $0.85 per million tokens | Qwen tokens per second × 86,400 × token value |
| Frontier API value | $10 per million tokens | Same throughput calculation with a premium hosted-model value |
| Model speed | Card-specific | Measured, reported, observed, or estimated, with the source type shown |
Mining ROI divides the hardware price by mining revenue after GPU electricity. The calculation excludes the host, cooling, pool fees, taxes, repairs, and resale value. A row without a current public Hashrate.no mining result shows n/a instead of an invented return.
API ROI divides the hardware price by daily token savings after local GPU electricity. This is a value-substitution model. The result is not revenue unless your local system performs billable work.
The table reports the best and worst positive payback path for each card. At low utilization, the API path stretches because the model assumes continuous generation. Set your expected active hours outside the explorer before making a purchase decision.
Representative Results
The full catalog appears below in an interactive frame. These rows show why speed, price, memory, and software support need to stay together.
| Card or system | Snapshot | Decision signal |
|---|---|---|
| RTX 3090 | 24GB, measured 40 tok/s, about $1,200 | Best modeled average and frontier token payback among the mainstream supported cards |
| RTX 4090 | 24GB, estimated 42.5 tok/s, about $2,589 | Best public mining payback in the current comparison, about 325 days after GPU power |
| RTX 5090 | 32GB, estimated 72.5 tok/s, about $4,999 | Faster 32GB CUDA option with a higher capital hurdle |
| Radeon AI PRO R9700 | 32GB, observed range around 31 tok/s, about $1,700 | Lower-cost AMD path with current ROCm and llama.cpp support, subject to runtime choice |
| AMD Strix Halo | 128GB unified memory, estimated 42 tok/s, about $4,000 | Large shared memory pool in a compact system, not discrete VRAM |
| DGX Spark | 128GB unified memory, reported estimate around 20 tok/s, about $5,300 | Compact Grace Blackwell system with a slower Qwen3.8 27B estimate than the Strix Halo row |
| H200 | 141GB, estimated 220 tok/s, about $32,500 | Highest modeled throughput, with a data-center price dominating payback |
| Instinct MI300X | 192GB, estimated 180 tok/s, about $22,000 | Large-memory AMD accelerator for throughput-focused deployments |
The 3090 result is measured. The remaining generation rates use a mixture of reported ranges, platform results, memory-bandwidth comparisons, and architecture estimates. The explorer labels the rate type beside each row. Do not treat an estimate as a benchmark on your own system.
Mining Payback Is Narrow
Hashrate.no rows provide a useful captured signal for cards with active mining data. They do not turn mining into a stable income stream. Coin prices, network difficulty, pool fees, algorithms, and hardware resale values change.
| Card | Mining calculation | Modeled result |
|---|---|---|
| RTX 4090 | $8.74 gross, $0.77 GPU power, $2,589 price | About $7.97 net per day and 325 days to hardware payback |
| RTX 3090 | $3.18 gross, $0.88 GPU power, $1,200 price | About $2.30 net per day and 522 days to hardware payback |
| RTX 3090 Ti | $3.81 gross, $0.57 GPU power, $1,434 price | About $3.24 net per day and 442 days to hardware payback |
| RTX 5090 | $12.80 gross, $1.59 GPU power, $4,999 price | About $11.21 net per day and 446 days to hardware payback |
| RTX PRO 6000 Max-Q | $9.40 gross, $0.83 GPU power, $13,250 price | About $8.57 net per day and 1,545 days to hardware payback |
The 4090 wins this subset because the captured gross estimate remains high relative to the street price. A mining result does not prove the card is a good local inference purchase. Mining cards often sit idle between workloads, while a local model produces value only when someone sends work to the card.
API Token Savings Changes the Ranking
API savings favor cards with a lower purchase price and a usable generation rate. The frontier scenario uses a high token value, so local hardware becomes more favorable for workloads which otherwise send a steady stream of tokens to a premium model.
The 3090 illustrates the effect. At 40 tokens per second and the default average token value, the card produces about $1.97 per day after GPU electricity. At the frontier value, the card produces about $33.59 per day after electricity. The purchase price divides into about 609 days at the average value or 36 days at the frontier value.
The conclusion changes when the model runs for two hours per day rather than 24 hours. Divide the daily savings by 12 for the usage pattern, then add system cost and maintenance. The same 3090 frontier path moves from about 36 calendar days to roughly 430 active-use days before extra costs.
A local GPU does not save API money while powered off. The relevant input is completed work, not the theoretical maximum generation rate.
Runtime Support Is Part of the Price
The explorer shows four runtime paths. The explorer separates current support from older paths which need pinned drivers, custom builds, or an older ROCm release.
| Status | Meaning |
|---|---|
| Native | The current documented path works with normal supported software |
| Conditional | The path works with a compatible driver, Linux setup, device permission, or matched release |
| Warning, legacy | The hardware is usable, but current builds often need version pinning or architecture flags |
| No | The current path is not a supported choice for the card in this comparison |
NVIDIA cards show native CUDA and llama.cpp support. Ollama follows the NVIDIA CUDA path. ROCm is not applicable to those cards, so the explorer does not mark an irrelevant path as a failure.
Current AMD RDNA cards show native ROCm and llama.cpp paths, with Ollama marked conditional because the Linux driver and ROCm device path still need to match the installed release. The R9700 is a strong example of why software support matters. Its price per gigabyte looks good, yet the preferred backend changes the result.
The explorer flags Tesla P40 and Tesla V100 as legacy NVIDIA generations. The explorer flags MI50 and MI60 as legacy Vega20 hardware. The explorer gives MI100 a CDNA1 compatibility warning because a matched gfx908 target and ROCm release matter. These warnings apply to similar-generation cards, not only the exact examples.
A cheap card with a broken default runtime is not a cheap working system. Count the driver work, cooling, adapters, host platform, and test time in the purchase price.
Unified Memory Needs a Separate Label
DGX Spark and Strix Halo appear in the same table because both offer large memory pools for local inference. Their memory is unified system memory, not discrete VRAM.
The CPU, operating system, and model runtime share the pool. A 128GB label does not give the inference backend a guaranteed 128GB allocation. Memory pressure, allocation policy, bandwidth, and the backend determine the usable limit.
The DGX Spark row uses a Best Buy street price near $5,300 and a reported Qwen3.8 27B estimate near 20 tokens per second. The Strix Halo row uses a Micro Center price near $4,000 and an estimate near 42 tokens per second based on a related Ryzen AI Max+ result. Both entries need a direct workload test before purchase.
Use unified memory when capacity, compact size, and low setup friction matter. Use discrete VRAM when you need predictable allocation and higher generation throughput for a supported backend.
Which Cards Fit Which Goal?
Choose the 3090 for low-cost local use
The 3090 offers 24GB, a measured Qwen3.8 27B rate, native CUDA support, and a lower street price than current high-end cards. Its weaknesses are age, power draw, heat, and a used-market warranty position.
Choose the 4090 for mining plus inference
The 4090 has the strongest modeled mining payback in this snapshot and remains fast for local inference. The card still has only 24GB, so context and quantization limits matter for larger workloads.
Choose the 5090 for a 32GB CUDA workstation
The 5090 gives a simple 32GB CUDA path with high estimated throughput. The price needs frequent local use or a high-value workload. Its 575W board power also needs a serious power supply and cooling plan.
Choose the R9700 for an AMD path
The Radeon AI PRO R9700 offers 32GB and a lower modeled price. Choose the card when ROCm and llama.cpp match your operating system and workload. Test Ollama before relying on the card as the only front end.
Choose Strix Halo or DGX Spark for unified memory
These systems suit buyers who want a compact local-AI box with a large shared memory pool. They trade discrete-GPU allocation and throughput for system integration and capacity.
Avoid legacy cards unless maintenance is the project
P40, V100, MI50, MI60, and MI100 prices look attractive because the hardware is old or specialized. The software stack is the cost. Buy one only when you have a tested driver, backend, cooling plan, and rollback path.
Use the Explorer Before Buying
The embedded explorer keeps the assumptions visible. Change the power rate, token values, VRAM range, architecture family, support state, or sort order. Click a row for its calculation detail and source links.
Use the no hacks filter for a first pass. Use the legacy warning labels to decide which cards need a separate test environment. Sort by mining, average API, frontier API, or worst modeled ROI after entering your own token value.
Limits of the Model
The model does not include the whole computer. Add the motherboard, CPU, memory, storage, power supply, chassis, cooling, network, and operating system when comparing a new build.
The model uses GPU power, not wall power. A 350W GPU does not mean a 350W system. Measure the host at the wall when the result affects a purchase.
The mining rows are snapshots. Crypto revenue changes faster than a static article. Recheck Hashrate.no before switching a card from inference to mining.
Most Qwen rates are estimates. Record the model quantization, context length, backend, driver, batch size, prompt length, and power state when you reproduce a rate.
API savings is not guaranteed revenue. A local model creates financial value only when the card replaces a paid call, supports a billable workflow, or avoids a real operational cost.
Recommendation
Start with a used RTX 3090 when your priority is low-cost local Qwen inference. The card has the strongest modeled token payback in this set under the stated frontier and average token values.
Choose the RTX 4090 when active mining revenue matters and you still want a fast local card. The captured mining row gives the card the best mining payback in the comparison.
Choose the RTX 5090 when 32GB, CUDA, and a simple workstation path matter more than purchase price. Choose the R9700 when an AMD ROCm path fits your host and you accept backend testing.
Rent or test before buying a data-center accelerator. H100, H200, MI210, MI250, and MI300X offer large memory and high estimated throughput. Their capital cost makes utilization the central decision.
The useful comparison is not dollars per gigabyte. The decision weighs usable memory, completed tokens, runtime support, electricity, purchase cost, and the number of hours your workload runs.
Sources
- Hashrate.no GPU profitability data , current mining rows and card references.
- llama.cpp CUDA backend , CUDA architecture support reference.
- Ollama GPU documentation , NVIDIA and AMD runtime notes.
- ROCm compatibility matrix , current AMD support boundary.
- AMD ROCm llama.cpp guide , AMD inference path.
- NVIDIA DGX Spark , GB10 unified-memory system reference.
- AMD Ryzen AI Halo Developer Platform , Strix Halo street-price reference.
- 32GB VRAM for Qwen 27B hardware guide , related memory and hardware analysis.
- Local AI model and GPU context guide , related context and runtime analysis.
- Qwen3.8 27B rental GPU benchmark , related benchmark conditions and rental comparison.
Snapshot date: 2026-10-10. Prices and mining results need a fresh check before purchase.

Related Posts