
Mastering Wireshark: A Comprehensive Beginner’s Guide to Network Analysis
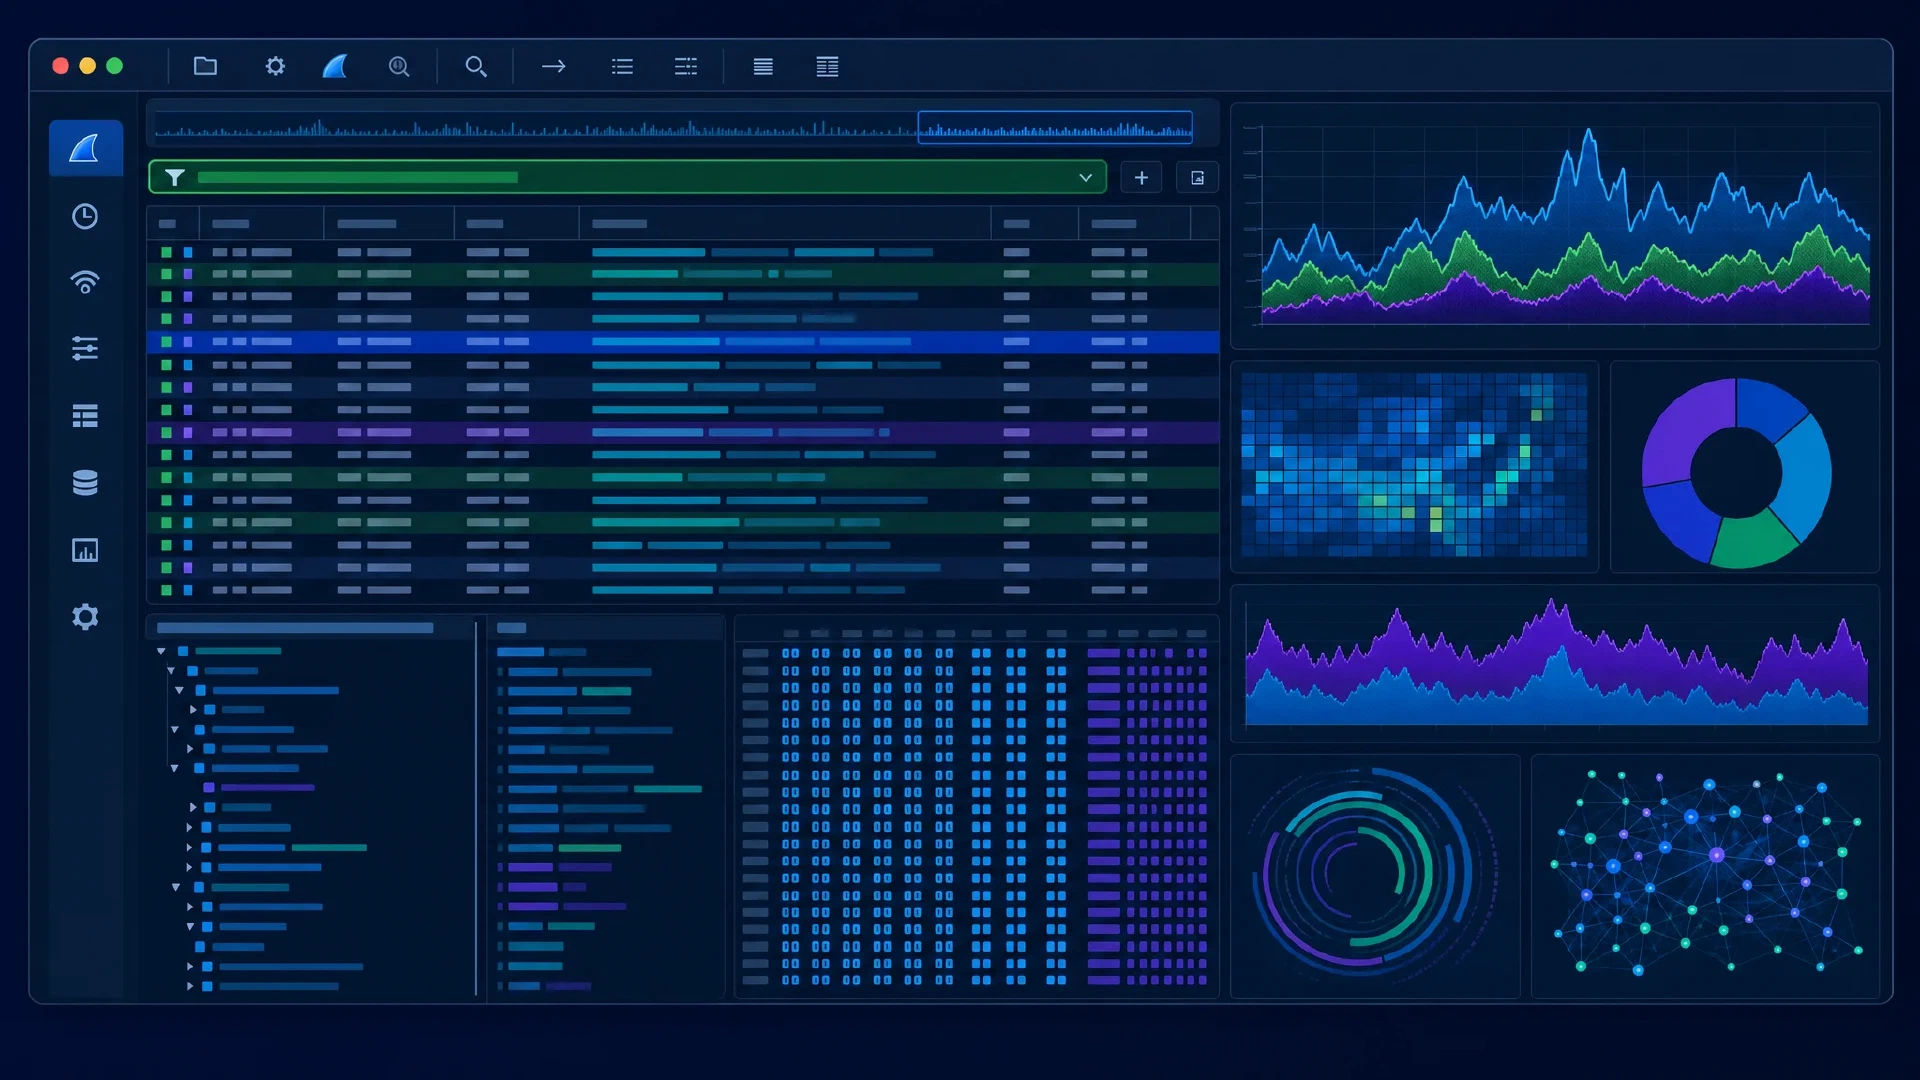
Table of Contents
A Beginner’s Guide to Using Wireshark for Network Analysis and Troubleshooting
Introduction
Wireshark is a powerful, open-source network protocol analyzer that enables users to monitor, capture, and analyze network traffic. It is widely used by network administrators, security professionals, and developers for troubleshooting, network analysis, and education purposes. In this article, we will cover the basics of using Wireshark for network analysis and troubleshooting, including its installation, interface, essential features, and some common use cases.
Installation and Setup
Before diving into the world of network analysis with Wireshark, you’ll need to download and install it on your computer. Wireshark is available for Windows, macOS, and Linux. To download the latest version, visit the Wireshark official website .
After downloading and installing Wireshark, you may need to install the required drivers and configure your system for optimal performance. The official Wireshark documentation provides detailed instructions for specific operating systems.
Wireshark Interface
When you open Wireshark for the first time, you’ll see a user-friendly interface with several panels, each serving a specific purpose.
- Capture Interface List: Displays the available network interfaces on your computer. To start capturing packets, simply select an interface and click the “Start” button.
- Packet List: Displays the captured packets in chronological order. You can apply filters to view specific packets based on your requirements.
- Packet Details: Shows detailed information about the selected packet, including the protocol stack and individual header fields.
- Packet Bytes: Displays the raw data (hexadecimal and ASCII) of the selected packet.
Capturing and Filtering Packets
To capture packets, simply select the desired network interface and click the “Start” button. Wireshark will then start monitoring the network traffic and display captured packets in real-time.
Packet filtering is a critical feature of Wireshark, as it allows you to focus on specific traffic based on various parameters, such as IP addresses, protocols, or port numbers. You can apply filters using the “Filter” bar located above the Packet List panel. For example, to filter packets with a specific IP address, you can use the following syntax: ip.addr == 192.168.1.1. Visit the
Wireshark Display Filters reference
to learn more about available filters.
Analyzing Network Traffic
Once you have captured and filtered packets, you can start analyzing the network traffic. Wireshark provides numerous built-in tools to help you interpret the data:
- Statistics: Offers a comprehensive view of various network statistics, such as conversations, protocol hierarchy, endpoints, and more. Access these statistics by navigating to the “Statistics” menu.
- Graphs: Visualize network data using graphs, which can help you identify patterns, trends, or anomalies. You can create graphs for different metrics, such as throughput, round-trip time, or window scaling, by navigating to the “Statistics” menu and selecting “IO Graphs” or “TCP Stream Graphs.”
- Expert Information: Provides insights into potential issues with the captured traffic, such as retransmissions, duplicate packets, or malformed packets. You can access this feature by clicking on “Analyze” in the menu bar and selecting “Expert Information.”
Troubleshooting Network Issues
Wireshark is an excellent tool for troubleshooting various network problems, such as latency, packet loss, or connectivity issues. Some common troubleshooting techniques include:
- Analyzing TCP Retransmissions: Excessive TCP retransmissions may indicate network congestion, packet loss, or other issues. Use the display filter
tcp.analysis.retransmissionto isolate retransmitted packets and analyze their characteristics. - Identifying Slow Network Connections: Determine whether slow network connections are caused by network latency or application delays by analyzing the round-trip time (RTT) between packets. Use the TCP Stream Graph feature to visualize the RTT values and identify possible bottlenecks.
- Detecting Unauthorized Access: Monitor network traffic for suspicious activities or unauthorized access attempts by filtering packets based on IP addresses, ports, or protocols.
A Beginner Capture Plan
Start with a question and a short capture window. Capture on the interface carrying the traffic under review, reproduce one problem, then stop and save the pcapng file with a timestamp. Packet captures often contain credentials, personal data, hostnames, and internal addresses. Store them as sensitive records and share them only with authorized people.
Use a capture filter to reduce packets written during capture. Use a display filter after capture to hide packets while preserving the file. The syntaxes differ. Wireshark’s guide documents both filter languages.
| Goal | Display filter | What to check |
|---|---|---|
| DNS failure | dns | Query name, response code, server address, and response delay. |
| TCP setup | tcp.flags.syn == 1 | SYN, SYN-ACK, and final ACK for the intended endpoint. |
| Retransmissions | tcp.analysis.retransmission | Direction, timing, and whether loss repeats on one path. |
| One host | ip.addr == 192.168.1.20 | Traffic to or from the selected host. |
| One service | tcp.port == 443 | The selected TCP port, without assuming the application. |
For a terminal workflow, tshark -i <interface> -f "host 192.168.1.20" -w incident.pcapng writes a pcapng capture with a libpcap capture filter. tshark -r incident.pcapng -Y "dns or tcp.analysis.retransmission" reads the file with a display filter. Replace the interface, address, and file name with values from your authorized test.
Select a packet and use Analyze > Follow to inspect a protocol stream. Wireshark supports TCP, UDP, TLS, HTTP, HTTP/2, QUIC, WebSocket, SIP, and other stream types. Following a stream does not decrypt TLS by itself. The Wireshark stream guide explains the scope and limits.
Treat Expert Information as a lead. A retransmission, duplicate packet, or malformed packet needs correlation with timestamps, endpoints, interface counters, and application logs. Wireshark’s documentation states that expert information is a starting point, not proof of a fault.
Following Government Regulations
Certain government regulations, such as the General Data Protection Regulation (GDPR) and the Health Insurance Portability and Accountability Act (HIPAA) , require organizations to protect sensitive information and maintain network security. Wireshark can help you comply with these regulations by monitoring network traffic for unauthorized access or data leakage.
Keep in mind that using Wireshark to capture and analyze network traffic may also fall under legal and ethical considerations. Always ensure you have proper authorization and adhere to your organization’s policies and local laws before using Wireshark for network analysis.
Conclusion
Wireshark is a powerful and versatile tool for network analysis and troubleshooting. By understanding its features and learning how to use them effectively, you can improve your organization’s network security, optimize network performance, and comply with government regulations.
References
- Wireshark - Go Deep.
- Wireshark User’s Guide
- General Data Protection Regulation (GDPR)
- Health Insurance Portability and Accountability Act (HIPAA)
- Wireshark TShark Manual
- Wireshark Follow Protocol Streams
- Wireshark Expert Information
Remember to practice and experiment with Wireshark on your own to gain a deeper understanding of its capabilities. The more you use it, the more proficient you’ll become in identifying and resolving network

Related Posts